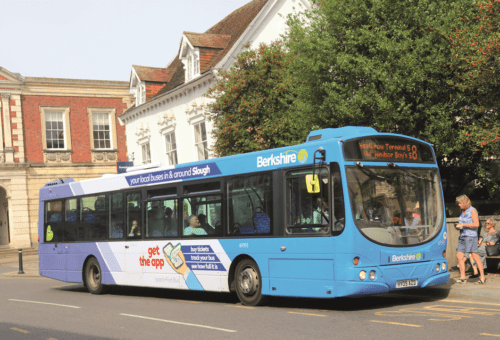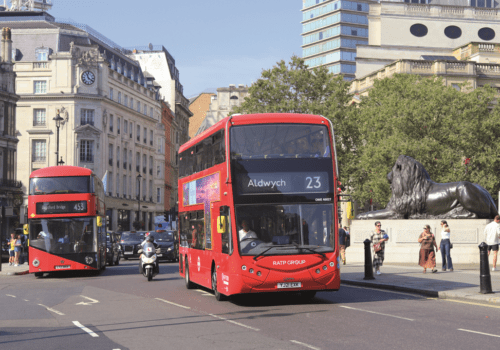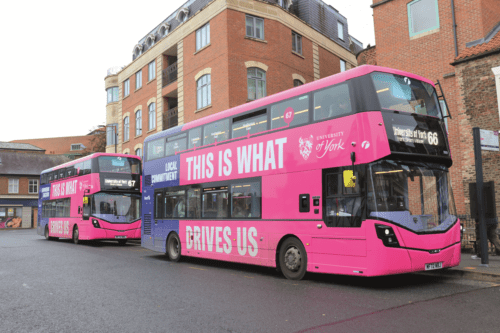
The number of bus journeys in England rose by almost a fifth in England, compared to a 29% rise in Scotland, in the period to March 2023, latest DfT figures show
Bus passenger journeys in England increased by 19.3% in the year to March 2023, the latest figures from the Department for Transport (DfT) show, representing a rise of 0.5bn to 3.4bn. The figure remained below pre-Covid levels of 4.1bn for the year to March 2020.
Bus mileage in England saw a decrease when compared to the year ending March 2022 of 49.8 million miles or 4.6%, which may reflect how bus operators have adjusted operations to realign with post-pandemic trends.
Concessionary journeys of all types made up 31.1% of all local bus passenger journeys in England, slightly lower when compared with the year ending March 2022 (32.7%) and the year ending March 2020 (33.6%). Outside London, total concessionary journeys made up 29.3% of all passenger journeys, lower than in London where the figure was 32.9%, whilst a change in the distribution of journeys throughout the day also remains apparent.
Looking at the longer-term trend, over the period since 2005, bus use saw a slight increase through to the year ending March 2009, after which it remained fairly stable until the year ending March 2015, before gradually beginning to fall again up to March 2020, when the pandemic took hold.
London bus journeys accounted for 52.2% of all passenger journeys made by local buses in England in the year ending March 2023, a total of 1.8 billion, and an increase of 19.6% compared with the year ending March 2022. London bus use had been increasing since 2005, before starting to fall again from 2013.
Outside London, there were 1.6 billion passenger journeys made by local buses in England, an increase of 19% though ridership still remains below pre-pandemic levels. Bus use in England outside London has been on a downward trend since a peak of 2.41 billion passenger journeys in the year ending March 2009.
Breaking the figures down further shows that in metropolitan areas, there were 0.7 billion passenger journeys in the year ending March 2023, an increase of 18.4% from the previous year, while in non-metropolitan areas, there were 0.9 billion passenger journeys, an increase of 19.4%.
The average number of bus passenger journeys per head in England outside London was 34 in the year ending March 2023, higher than the previous year but still lower than in the year ending March 2020, when the figure was 42, down from a peak of 55 in the year ending March 2009.

Buses
In the year ending March 2023, there were 1 billion bus service miles run in England, a slight decrease of 4.6% when compared with the year ending March 2022 and 10.6% lower than the year ending March 2020. Outside London, bus mileage saw a decrease of 5.1% compared to the previous year but was 13% lower than in the year ending March 2020. By contrast, London bus mileage saw a smaller decrease of 3.4%, but has changed relatively little since the year ending March 2005, fluctuating between around 282 and 304 million vehicle miles.
In general, between the year ending March 2005 and the year ending March 2017 commercial mileage increased slightly before gradually decreasing until the year ending March 2020. The latest figures show there was a decrease by 7.8% for the year ending March 2023 over the previous year. Supported mileage as a percentage of total mileage in England outside London gradually increased from 21.7% up to March 2005 before starting to gradually decrease from the year ending March 2010 onwards. In recent years this decrease has flattened out, with supported mileage representing 12.9% of total mileage for the year ending March 2022, and a 12.3% in the last year.
Figures show that in March 2023 there were 30,154 buses used by local bus operators, of which 8,788 buses were in London. The overwhelming majority have CCTV, whilst 22% had charging points and a quarter had free WiFi. 93% were enabled for payment by contactless bank card, 98% had an automatic vehicle location (AVL) device, but only 49% provided audio visual information.
These figures represent an overall decrease in the number of buses in England by 3.8% from 31,358 in March 2022. The majority dated from around 2007 to 2020, and the most most common year of manufacture for a bus operated in England was 2016.
At the regional level, bus service punctuality in the year ending March 2023 varied between 75% and 87%. At the local authority level, there was greater variation ranging between 62% and 99%.
Fares
The local bus fares index saw a decrease of 2.1% in England between March 2022 and March 2023, stopping the upward trend that has been seen since 2005, and likely driven most by the £2 fare cap which has been in place since January. Looking in more detail, the local bus fares index showed a 6% increase in London, a 4.3% decrease in metropolitan areas, an 11.4% decrease in non-metropolitan areas, and a 7.9% decrease in England outside London.
Staffing
Local bus operators in England employed an estimated 87,000 full-time equivalent staff, including maintenance and admin staff, in March 2023, a decrease of 1.1% compared to 2022. Figures from the Annual Survey of Hours and Earnings in the year ending March 2023 showed that the median number of hours that bus drivers work is 40 per week, more than the national median of 37, and they earn £541.80 a week, slightly below the national median figure of £561.80.
The average age of bus and coach drivers for the period 2020 to 2022 was 52, up from 49 for the period from 2013 to 2015. 52% of bus and coach drivers were aged 53 or over in the period covering 2020 to 2022, an increase from 44% in the period covering 2013 to 2015. The majority of bus drivers were found to be male (91%) for the period 2020 to 2022, almost unchanged since the 2013 to 2015 period.


