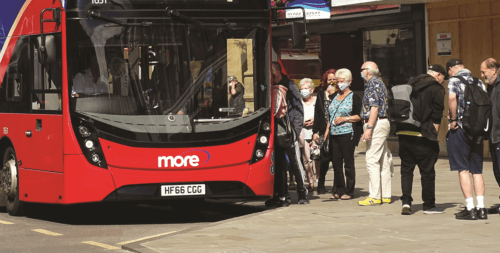
The latest facts and figures from the Office of National Statistics shows that the number of local bus passenger journeys in England was 3.09 billion in the year ending June 2022, a 55% increase compared to the previous year. Whilst the numbers have continued to rise each quarter, the current number of bus passenger journeys was still well below pre-Covid-19 levels; there were 4.22 billion passenger journeys in England in the year to December 2019. Data showed that the lower levels of ridership were broadly consistent across different areas, with current bus passenger journeys 29% lower in non-metropolitan areas, and 28% lower in metropolitan areas. London has shown the greatest recovery, with the number of bus passenger journeys at 25% lower than its pre-Covid-19 level.
Looking at the longer-term trend, after the drop during the pandemic there has been a steady increase in passenger numbers across England since April 2021, following a fairly consistent pattern regardless of metropolitan or non-metropolitan status. The quarter on quarter rise has continued at the same pace within London. However since January 2022, the increase has slowed across the rest of England. Passenger journeys throughout the country have remained below that of pre-pandemic levels.
Local bus fares in England for April to June 2022 increased by 4.2% compared to the same period in 2021, faster than in previous quarters and comparable to the all-items Consumer Prices Index (CPI) rate of increase in the same period (4.1%). The increase in local bus fares in England was largely driven by a 5.9% increase in London. In England outside London, local bus fares increased by 2.9%, with a noticeable difference in fare increases between metropolitan (1.1%) and non-metropolitan areas (4.2%).
Fares in England have continued to increase after a period of little change through 2020 to 2021, when fare increases were not allowed under the terms of the Covid-19 Bus Service Support Grant (CBSSG) in England. CBSSG has now been superseded by the Bus Recovery Grant (BRG), the terms of which allow for fare increases capped at the rate of inflation.
Between 2016 and 2018, the figures show that the 12 month rate of change in local bus fares and the CPI were relatively similar, but then diverged. The most recent quarter shows they are similar again, with the reintroduction of local bus fare increases under BRG bringing the rate of increase in line with that of the CPI. The longer-term trend shows that between June 2005 and June 2022, bus fares rose more in metropolitan areas (93%) than in non-metropolitan areas (79%), while fares in London have also risen (83%) over this period. The all-items CPI increased by 48% over the same period, meaning bus fares have risen in real terms, which differs from the more recent short-term picture.


